Troubleshoot an Availability Group database in reverting state
This article helps you troubleshoot an availability group database in reverting state.
What is reverting state?
Reverting state occurs when the secondary server must undo changes that it already applied in order to go back in sync with the primary.
Availability group primary and secondary replica(s) remain in a connected state during normal operation so that changes at the primary replica are actively synchronized with the secondary replica(s).
During failovers, this connected state is severed. Once the new primary replica has come online, connectivity is reestablished between the primary replica and secondary replica(s). During this initial connected state, a common recovery point is negotiated in which the new secondary should start recovery so that it's in sync with the primary.
If a large transaction is running at the time of the failover, the new secondary database log is ahead of the primary replica database. The new common recovery point negotiated will require the secondary replica to receive pages from the primary replica in order for it to be in a state where synchronization can resume. Reverting process is also called "Undo of Redo".
Reverting process is inherently slow, happens often, and typically small transactions triggering reverting state are hardly noticed. Reverting state is often noticed when failover interrupts a large transaction, causing many pages to be sent from the primary to the secondary to revert the secondary replica database to a recoverable state.
Symptoms and effect of an availability group database in reverting state
When a database is in reverting state on the secondary replica, the database isn't synchronized and therefore doesn't receive changes from the primary replica. A sudden loss of the database on the primary replica could result in data loss.
Always On dashboard reports Not Synchronizing on the primary
After failing over an availability group, you may observe that the secondary is reported as not synchronizing while the failover was successful. The Always On dashboard reports Not Synchronizing on the primary and Reverting on the secondary.
| Always On dashboard reports Not Synchronizing on the primary | Always On dashboard reports Reverting on the secondary |
|---|---|

|

|
Always On DMVs reports NOT SYNCHRONIZING on the primary
When you query the following Always On availability groups (AGs) Dynamic Management Views (DMVs) on the primary, the database is in the NOT SYNCHRONIZING state.
SELECT DISTINCT ar.replica_server_name, drcs.database_name, drs.database_id, drs.synchronization_state_desc, drs.database_state_desc
FROM sys.availability_replicas ar
JOIN sys.dm_hadr_database_replica_states drs
ON ar.replica_id=drs.replica_id
JOIN sys.dm_hadr_database_replica_cluster_states drcs
ON drs.group_database_id=drcs.group_database_id
When you query the DMVs on the secondary, the availability group database is in REVERTING state.
Read-only and reporting workloads fail to access the secondary database
While the secondary database is reverting, it can't be accessed or queried. These read-only workloads are offline and interrupted. Depending on how long the database is in reverting state, it may be necessary to reroute those workloads to another secondary replica or the primary replica if these workloads are business-critical.
If you have a read-only workload, like a reporting workload that is routed to the secondary replica, these batches may fail with message 922:
Msg 922, Level 14, State 1, Line 2 Database 'agdb' is being recovered. Waiting until recovery is finished.
An application trying to login to the secondary replica database in reverting state fails to connect and raises error 18456:
2023-01-26 13:01:13.100 Logon Error: 18456, Severity: 14, State: 38. 2023-01-26 13:01:13.100 Logon Login failed for user '<UserName>'. Reason: Failed to open the explicitly specified database 'agdb'. [CLIENT: <local machine>]
This error can also be reported in the SQL Server error log if failed logins are being audited.
Estimate the time remaining in reverting state
Use one of the following methods to estimate the time remaining in reverting state:
Use the AlwaysOn_health XEvent session
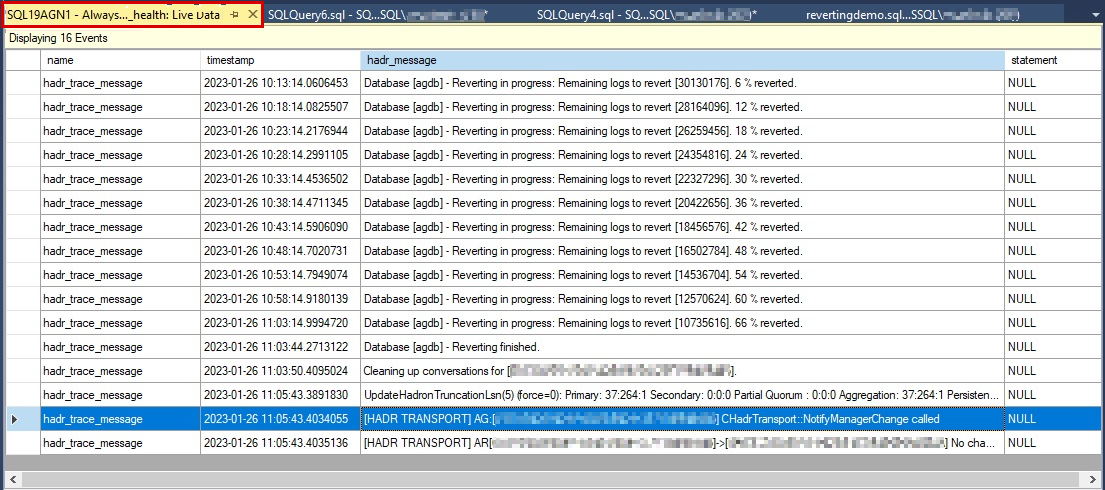
The AlwaysOn_health extended event diagnostic log has a hadr_trace_message event that reports reverting state progress every five minutes.
Connect to the secondary replica using SQL Server Management Studio (SSMS) Object Explorer and drill into Management, Extended Events, and then Sessions. Right-click the AlwaysOn_health event and select Watch Live Data. You should get a new tabbed window reporting the current state of reverting operation. The state is reported every five minutes via the hadr_trace_message event, and the completed percentage of reverting operation is reported.
Note
The extended event hadr_trace_message was added to the latest cumulative updates in SQL Server 2019 and later. You must be running the latest cumulative updates to observe this extended event in the AlwaysOn_health extended event session.
The SQL Server error log on the secondary replica isn't much help when estimating reverting completion. From the following image, you can observe from 10:08 to 11:03 while in reverting state, little is reported. Once the secondary has received all the pages from the primary replica, it's now able to roll back the transaction that was running on the original primary that triggered reverting state. Recovery runs from 11:03 to 11:05. Shortly after recovery completes, the database should begin to synchronize with the primary replica and catch up on all the changes made at the primary while the secondary database was in reverting state.
Monitor reverting completion time using Performance Monitor
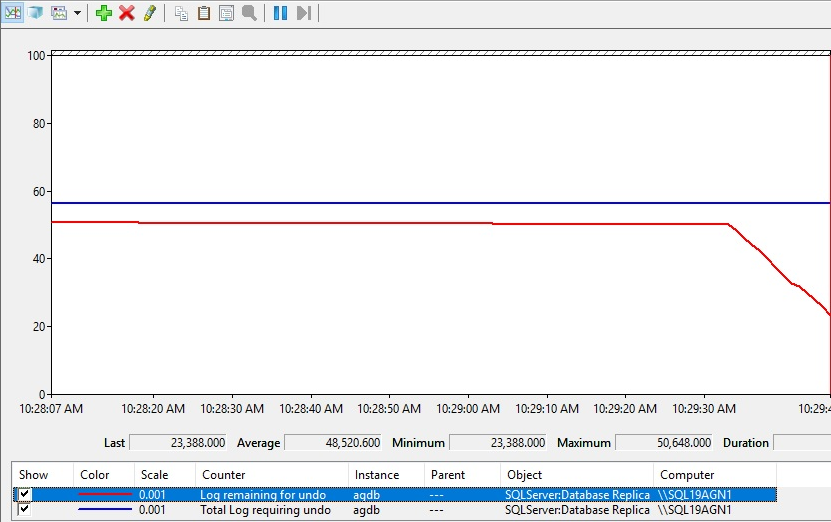
Monitor reverting state progress using the performance counters SQL Server:Database Replica:Total Log Requiring Undo and SQL Server:Database Replica:Log Remaining for Undo and choose the availability group database for the Instance. In the example in the following screenshot, Total Log Requiring Undo is reported as 56.3 mb, and Log Remaining for Undo is slowly dropping to 0 that is reporting reverting progress.
What are your other options other than waiting?
Microsoft recommends that you estimate the time for completion of reverting state.
Add a secondary replica to an availability group
If there are only two replicas in the availability group, if possible, add another secondary replica that can provide high availability and redundancy and actively synchronize with the primary replica while the other secondary completes reverting.
Important
Don't fail over to a replica whose database(s) are in reverting state. This may result in an unusable database that requires a restore from backup. Don't restart the secondary replica instance, it will not accelerate this process and may compromise the state of the secondary replica database that's in reverting state.
How to address failing read-only workloads
Since the secondary replica databases in reverting are inaccessible, read-only workloads are failing. Update the read intent routing table to route traffic back to the primary replica or to another secondary replica until the affected secondary replica database completes reverting process.
Avoid reverting state - monitor for large transactions
If you're observing this state frequently during planned failovers, implement a procedure that checks for large transactions prior to failovers. The following query reports the transaction begin time and current time of any open transactions on the system and provides the input buffer of the transactions.
SELECT tat.transaction_begin_time, getdate() AS 'current time', es.program_name, es.login_time, es.session_id, tst.open_transaction_count, eib.event_info
FROM sys.dm_tran_active_transactions tat
JOIN sys.dm_tran_session_transactions tst ON tat.transaction_id=tst.transaction_id
JOIN sys.dm_exec_sessions es ON tst.session_id=es.session_id
CROSS APPLY sys.dm_exec_input_buffer(es.session_id, NULL) eib WHERE es.is_user_process = 1
ORDER BY tat.transaction_begin_time ASC
Feedback
Coming soon: Throughout 2024 we will be phasing out GitHub Issues as the feedback mechanism for content and replacing it with a new feedback system. For more information see: https://aka.ms/ContentUserFeedback.
Submit and view feedback for


